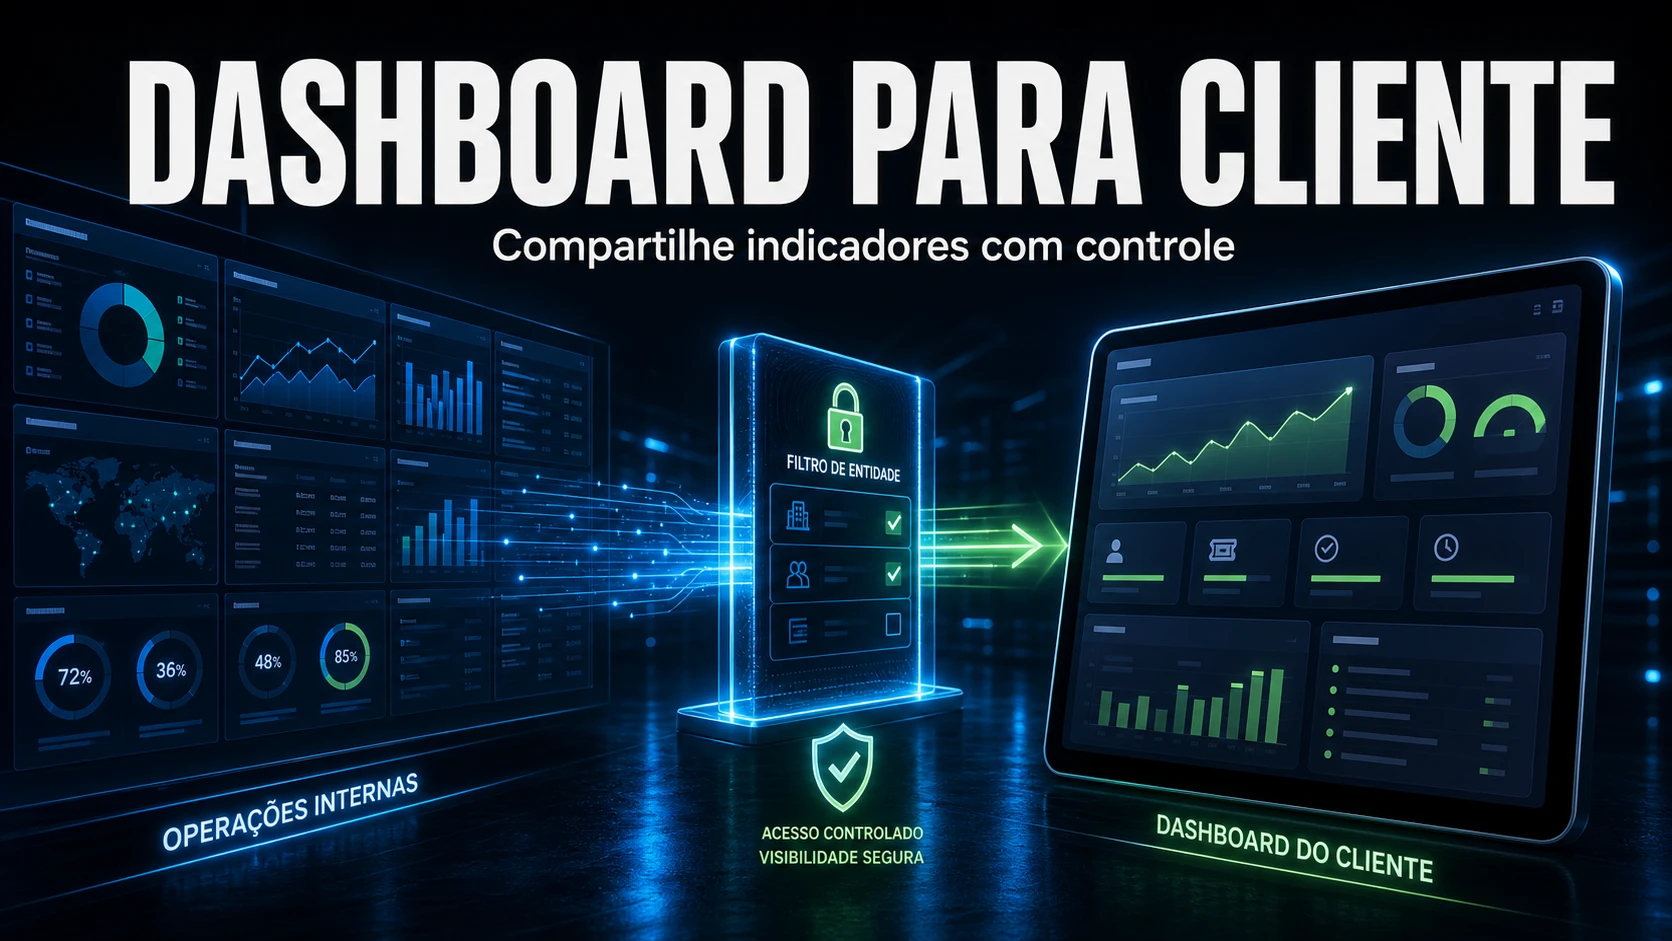
Transparency builds trust - but a poorly isolated dashboard turns into a data-protection incident. Sharing service metrics with clients cuts down on email chasing and signals professionalism. The technical challenge is not drawing the chart: it is making sure each client sees only their own tickets. Here is how to do it with GLPI + Metabase or Grafana, with the per-entity filter locked in the right place.
Before you publish: three decisions that define everything
Running multi-client GLPI environments, three choices decide whether the dashboard is a differentiator or a security problem:
- Where to lock the entity filter: in the link, in the query, or in a signed embed. Only the last one survives URL tampering.
- Which date to use for the period: creation (
date), solve (solvedate) or close (closedate). Mixing the three distorts every metric. - Where to read the data: the primary database or a read-only replica. Metabase and Grafana fire heavy queries and compete with GLPI in production.
Step 1 - a read-only database user
Never point the BI tool at the GLPI database user. Create a dedicated user with SELECT and nothing else. In MariaDB:
-- Read-only user for BI, restricted to the internal network
CREATE USER 'bi_ro'@'10.20.%' IDENTIFIED BY '...strong_password...';
GRANT SELECT ON glpi.* TO 'bi_ro'@'10.20.%';

-- Per-query time limit keeps a dashboard from stalling the database (MariaDB)
SET GLOBAL max_statement_time = 15;   -- seconds

FLUSH PRIVILEGES;
Where possible, point the BI tool at a read replica instead of the primary. That way a forgotten filter in a chart does not hold GLPI transactions in production - we have watched a single panel with a badly written JOIN degrade the response time of the whole help desk.
Step 2 - isolate by entity without leaking sub-entities
Each client is an entity in GLPI, and the instinct is to filter by entities_id = X. Here lies the most common trap: if the client has branches or departments as sub-entities, that filter captures only the root entity and the numbers come out smaller than reality. You must include the whole subtree. In MariaDB 10.2.2+ a recursive CTE does the job:
-- All of the client's entities (root + descendants)
WITH RECURSIVE client_tree AS (
    SELECT id FROM glpi_entities WHERE id = 4        -- client's root entity
    UNION ALL
    SELECT e.id
    FROM glpi_entities e
    JOIN client_tree c ON e.entities_id = c.id
)
SELECT
    COUNT(*)                       AS total,
    SUM(t.status IN (1,2,3,4))     AS open_tickets,
    SUM(t.status IN (5,6))         AS closed_tickets
FROM glpi_tickets t
WHERE t.entities_id IN (SELECT id FROM client_tree)
  AND t.is_deleted = 0;
Note the is_deleted = 0: GLPI uses soft deletes, and without that filter tickets sitting in the trash still get counted. It is the second most frequent fix we apply to dashboards inherited from another team.
Step 3 - SLA without inflating the percentage
The SLA compliance rate looks trivial: solved before the deadline, counted. The catch is in the time_to_resolve field (the SLA deadline stored on the ticket): it is NULL when no SLA is attached to the ticket. If you compare solvedate <= time_to_resolve without handling the NULL, those tickets vanish from the denominator and the percentage rises artificially. Make the population explicit:
WITH RECURSIVE client_tree AS (
    SELECT id FROM glpi_entities WHERE id = 4
    UNION ALL
    SELECT e.id FROM glpi_entities e
    JOIN client_tree c ON e.entities_id = c.id
)
SELECT
    COUNT(*)                                                          AS with_sla,
    SUM(t.solvedate <= t.time_to_resolve)                          AS on_time,
    ROUND(100 * SUM(t.solvedate <= t.time_to_resolve) / COUNT(*), 1) AS sla_pct
FROM glpi_tickets t
WHERE t.entities_id IN (SELECT id FROM client_tree)
  AND t.is_deleted = 0
  AND t.time_to_resolve IS NOT NULL      -- only tickets with an SLA
  AND t.solvedate IS NOT NULL            -- already solved
  AND t.date >= '2026-06-01'
  AND t.date <  '2026-07-01';
Which metrics make sense for the client
Not everything the internal team tracks is relevant - or should be exposed - to the client. A lean set works better:
- Operational: open tickets by status and priority, opened vs. closed in the period, average response and resolution time.
- SLA: percentage within deadline and tickets at risk (close to the
time_to_resolvedeadline). - Satisfaction: average survey score (
glpi_ticketsatisfactions) and monthly trend. - Contract: hours consumed vs. contracted and remaining balance, when there is a prepaid hours pool.
Where to lock the filter: a decision matrix
The trickiest point is stopping the client from swapping the parameter in the URL and seeing someone else's data. Each method enforces the filter in a different place:
| Method | Where the filter is enforced | Leak risk | Effort | When to use |
|---|---|---|---|---|
| Metabase - Public Link | Parameter editable in the URL | High | Low | Internal demos only, never with client data |
| Metabase - Signed Embed (JWT) | Parameter locked server-side (token) | Low | Medium | Recommended default for clients |
| Grafana - Anonymous Access | Exposes the whole organization | High | Low | Avoid |
| Grafana - Public Dashboards (9.1+) | One dashboard per link, no editable variable | Medium | Low | Single client, no sensitive sub-entities |
| Grafana - per-client organization | Isolated by org + proxy | Low | High | Many clients, strong isolation |
The trap that cost us the most (in day-to-day operations)
In an environment with dozens of entities, a client's dashboard showed roughly half the tickets that the manual report pointed to. The cause was not the counting query - it was Metabase's public link. The entity filter was a dashboard parameter, and anyone with the link could edit the value in the URL and browse other entities. We moved to a signed embed (JWT), with entities_id injected into the token and the parameter marked as locked. The client lost the ability to touch the filter and gained a number that finally matched the contract. The lesson we now carry into every project: dashboard security does not live in the query, it lives in where the filter is enforced.
Publishing checklist
- Read-only database user, ideally pointing at a replica.
- Entity filter including the subtree (recursive CTE or list of IDs).
is_deleted = 0on every query againstglpi_tickets.- Consistent period: pick one date (creation, solve or close) and use the same one on every card.
- Filter locked server-side (signed embed), never only in the URL.
- Test the link with an external user before sending it to the client.
Need client dashboards with tamper-proof per-entity isolation? NexTool deploys and maintains GLPI environments with integrated BI (Metabase and Grafana) and data governance aligned with data-protection law. Explore our support and maintenance service, or see the Metabase vs Grafana comparison and the essential service desk KPIs.
Reviewed by the NexTool Solutions team.