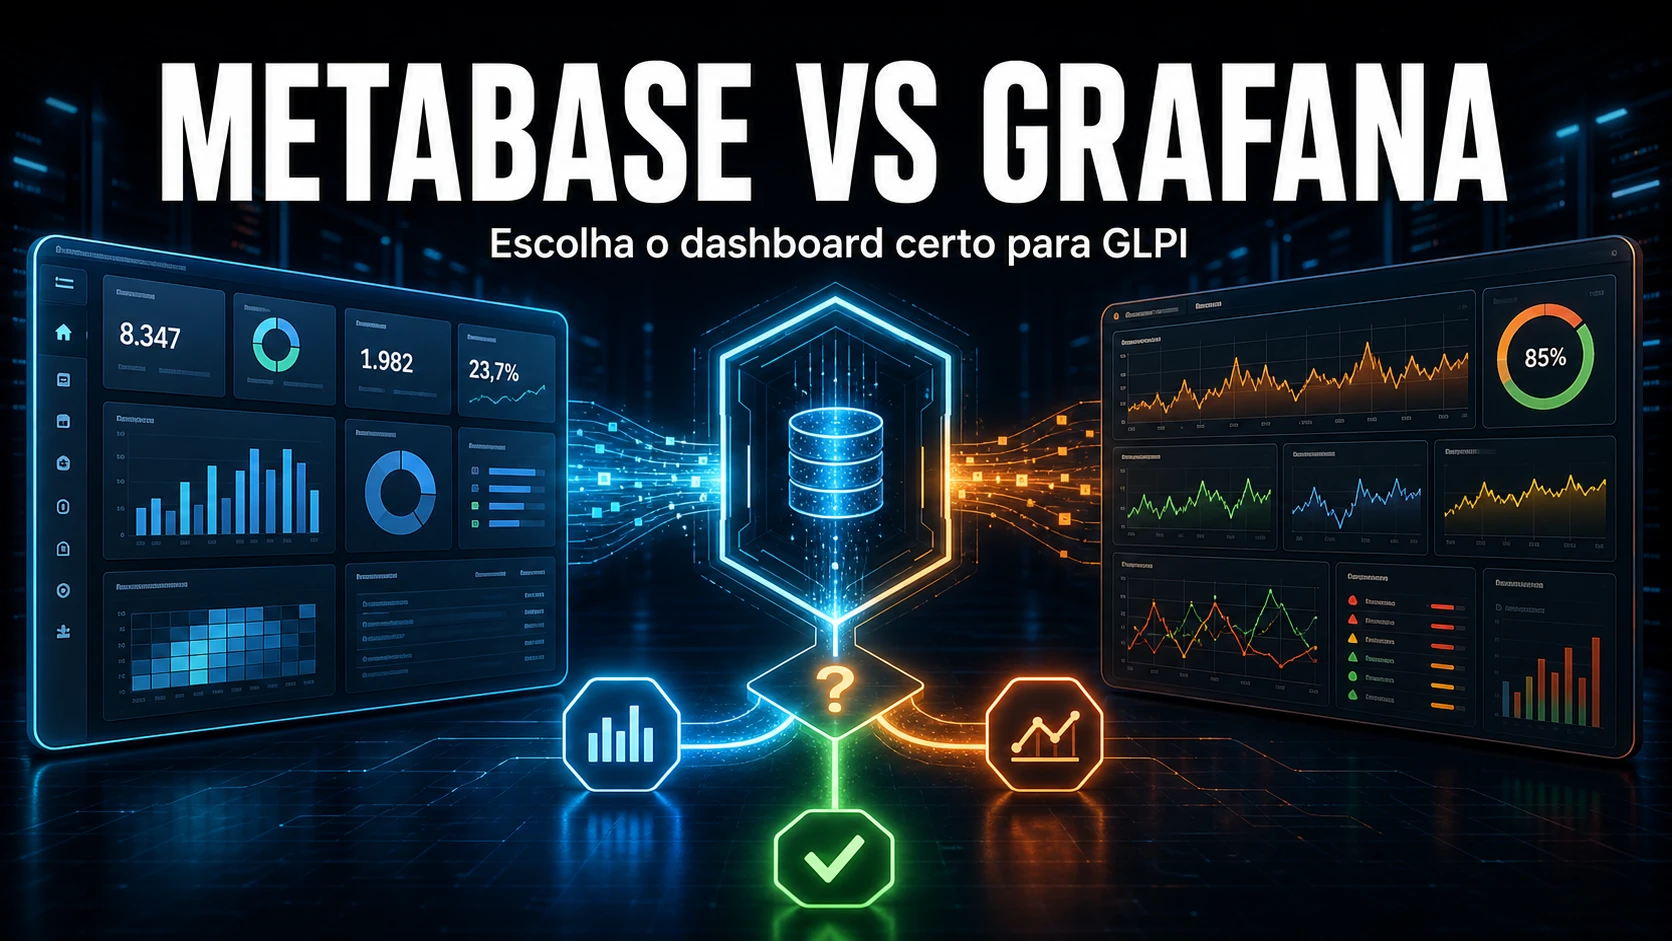
GLPI stores the entire service desk history, but native reports stop right where management starts asking "why". Metabase and Grafana read the same GLPI MariaDB database and turn that history into dashboards - but they solve different problems, and choosing wrong costs rework.
What changes when you plug BI into GLPI
Before comparing the two tools, you need to understand that the GLPI database was not designed for BI. Three details drive most of the work on any dashboard, whether in Metabase or Grafana:
- Status, priority and urgency are numbers, not text. In
glpi_tickets, thestatuscolumn runs from 1 (New) to 6 (Closed). No tool knows this on its own - if you do not translate the codes, the manager sees "status 2" on the chart. - Nothing is truly deleted. GLPI uses soft delete:
is_deleted = 1flags a record as "in the trash". Forgetting theis_deleted = 0filter inflates every count. - It is multi-entity. The
entities_idcolumn segregates data by client or department. A dashboard a client will see must filter the right entity subtree - and that is not free in plain SQL.
Add a fourth, purely operational point: pointing BI straight at the production database, during business hours, with queries that scan the whole glpi_tickets table joined with glpi_logs, is the fastest way to slow GLPI itself down. More on that below.
Head-to-head comparison
| Criterion | Metabase | Grafana |
|---|---|---|
| Stack | Java application | Go application |
| Target audience | Management, client, analyst | Technical team and NOC |
| Query model | Visual editor or SQL | SQL on every panel |
| Time series / real time | Periodic refresh (cache) | Native (time macros, auto-refresh) |
| Time-range selector | Manual filter per question | Global time picker at the top |
| Dynamic filter by entity | Filters and parameters | Template variables via SQL |
| Alerts | Basic (email) | Advanced (email, Slack, Teams, webhook) |
| Per-client segregation (row-level) | Sandboxing paid only; on free, 1 question per entity | Template var + organizations; manual control |
| Embed / sharing | Public link and signed embedding (JWT) | iframe (allow_embedding) and public dashboards |
| Dashboard as code | Limited in the free version | Native (versionable YAML/JSON provisioning) |
| Memory footprint | Higher (Java heap, ~2 GB or more) | Low (hundreds of MB) |
| Best for | Navigable, exportable management reports | Live operational dashboard |
| Cost | Open source; paid Pro/Enterprise | Open source; paid Enterprise |
How to connect without dragging GLPI down
Regardless of the tool, the connection is the same: a read-only database user, ideally pointing at a replica or a copy restored overnight, never at the production master with write permission.
-- Read-only user for the BI tool (run on GLPI's MariaDB/MySQL).
-- Point it, preferably, at a replica or a restored copy,
-- never at the production master with write permission.
CREATE USER 'bi_ro'@'10.0.0.%' IDENTIFIED BY '${STRONG_PASSWORD}';
GRANT SELECT ON glpi.* TO 'bi_ro'@'10.0.0.%';
FLUSH PRIVILEGES;
With access ready, the first artifact that fixes the "raw numbers" problem is a query that translates the status codes. It works for both: in Metabase it becomes a "SQL Question", in Grafana a table or bar panel.
-- Open tickets by status, with the codes translated.
-- In GLPI, glpi_tickets.status runs from 1 to 6.
SELECT
  CASE status
    WHEN 1 THEN 'New'
    WHEN 2 THEN 'Processing (assigned)'
    WHEN 3 THEN 'Processing (planned)'
    WHEN 4 THEN 'Pending'
    WHEN 5 THEN 'Solved'
    WHEN 6 THEN 'Closed'
  END AS ticket_status,
  COUNT(*) AS total
FROM glpi_tickets
WHERE is_deleted = 0          -- ignore the trash (soft delete)
  AND status IN (1, 2, 3, 4)  -- only those still open
GROUP BY status
ORDER BY status;
Metabase has a shortcut: instead of the CASE, you can map the column values right in the field settings (1 to "New", 2 to "Processing" and so on), and the label shows up automatically in every chart. That is a productivity win Grafana does not have - there the CASE is mandatory.
Grafana: dashboard as code
Grafana's advantage for anyone running many environments is not on screen, it is on disk: data source and panels are versionable files. We provision the same dashboard across several clients from a YAML and a JSON in Git, without clicking anything.
# /etc/grafana/provisioning/datasources/glpi.yaml
# Versionable data source: the same file provisions N environments.
apiVersion: 1
datasources:
  - name: GLPI-MariaDB
    type: mysql
    access: proxy
    url: mariadb.internal:3306
    database: glpi
    user: bi_ro
    jsonData:
      maxOpenConns: 5             # cap the connections: do not choke GLPI
      timezone: America/Sao_Paulo
    secureJsonData:
      password: ${GLPI_BI_PASSWORD}
The other differentiator is time. Grafana understands time series natively: with the $__timeFilter and $__timeGroup macros, the time-range selector and the auto-refresh at the top of the screen start driving the query, and a template variable becomes a dynamic entity filter.
-- Time-series panel: the macros wire in the time picker at the top.
SELECT
  $__timeGroup(date, '1d') AS time,    -- group by day
  COUNT(*)                 AS opened
FROM glpi_tickets
WHERE is_deleted = 0
  AND entities_id IN (${entity})        -- template variable (filter by client)
  AND $__timeFilter(date)               -- honor the range chosen on screen
GROUP BY 1
ORDER BY 1;

-- Query that feeds the "entity" template variable:
SELECT name AS __text, id AS __value
FROM glpi_entities
ORDER BY completename;
The trade-off that shows up in sustaining operations
In sustaining GLPI estates for clients, the decision is rarely technical - it is about who will look at the dashboard. The most common mistake we fix is always the same: someone picks Grafana because "it is more powerful", builds a flawless operational dashboard, and three months later the director asks for a monthly report of tickets by category with export for the client. In Grafana that is painful: it was built for live metrics, not for a manager to browse and export tables. Then Metabase comes in, and the environment becomes two BIs to maintain.
One detail only operations reveals is per-client segregation. In a consultancy serving several clients on the same GLPI (or on separate GLPIs), you must guarantee that client A's dashboard never shows client B's tickets. In Metabase, true row-level security - per-user sandboxing - is a paid feature; on the free version, the workaround is one question per client with a fixed entities_id in the WHERE, which multiplies maintenance. In Grafana, we solve it with a template variable tied to entities, but access control stays in your hands. There is no free shortcut for multi-client isolation - we decide case by case, and when in doubt we separate by instance, not by query.
Verdict by scenario
Choose Metabase when the audience is management, clients or analysts without SQL. The learning curve is low, reports come out navigable and exportable, and visual status mapping solves the "raw numbers" without writing a CASE. It is the best tool for getting service desk data to people who never open a terminal.
Choose Grafana when the dashboard is operational and live - queue by group, SLA at risk, tickets per hour - for the technical team or the NOC. The time picker, auto-refresh, multi-channel alerts and provisioning as code are real advantages Metabase does not cover well.
Use both when the same GLPI serves different audiences: Grafana on the operations wall, Metabase in the hands of management and the client. It is common and it works, but accept the cost of maintaining two BIs - do not take that route "just to be safe".
Cost and effort
Licensing is not the axis of the decision: both have a free open source edition that handles GLPI dashboards, and the paid plans (Metabase Pro/Enterprise, Grafana Enterprise) only matter at scale or for governance. The real cost is modeling. The heavy part is not installing - it is knowing the GLPI schema: mapping statuses and priorities, remembering is_deleted, resolving the entity tree and not burdening production. As an honest range: a handful of operational Grafana panels goes up in an afternoon; a set of well-modeled management reports in Metabase, with per-client filters and translated statuses, usually takes two to four days of work to become reliable. To decide which metrics belong on each dashboard, see our guide to Service Desk KPIs in GLPI.
At NexTool we deploy Metabase and Grafana on top of clients' GLPI on both fronts - management reporting and operational dashboards - always with a read-only user and without dragging production down. If you want the right dashboards for the right audience, without being hostage to a BI that does not fit, our consulting designs that indicator layer end to end.
Reviewed by the NexTool Solutions team.