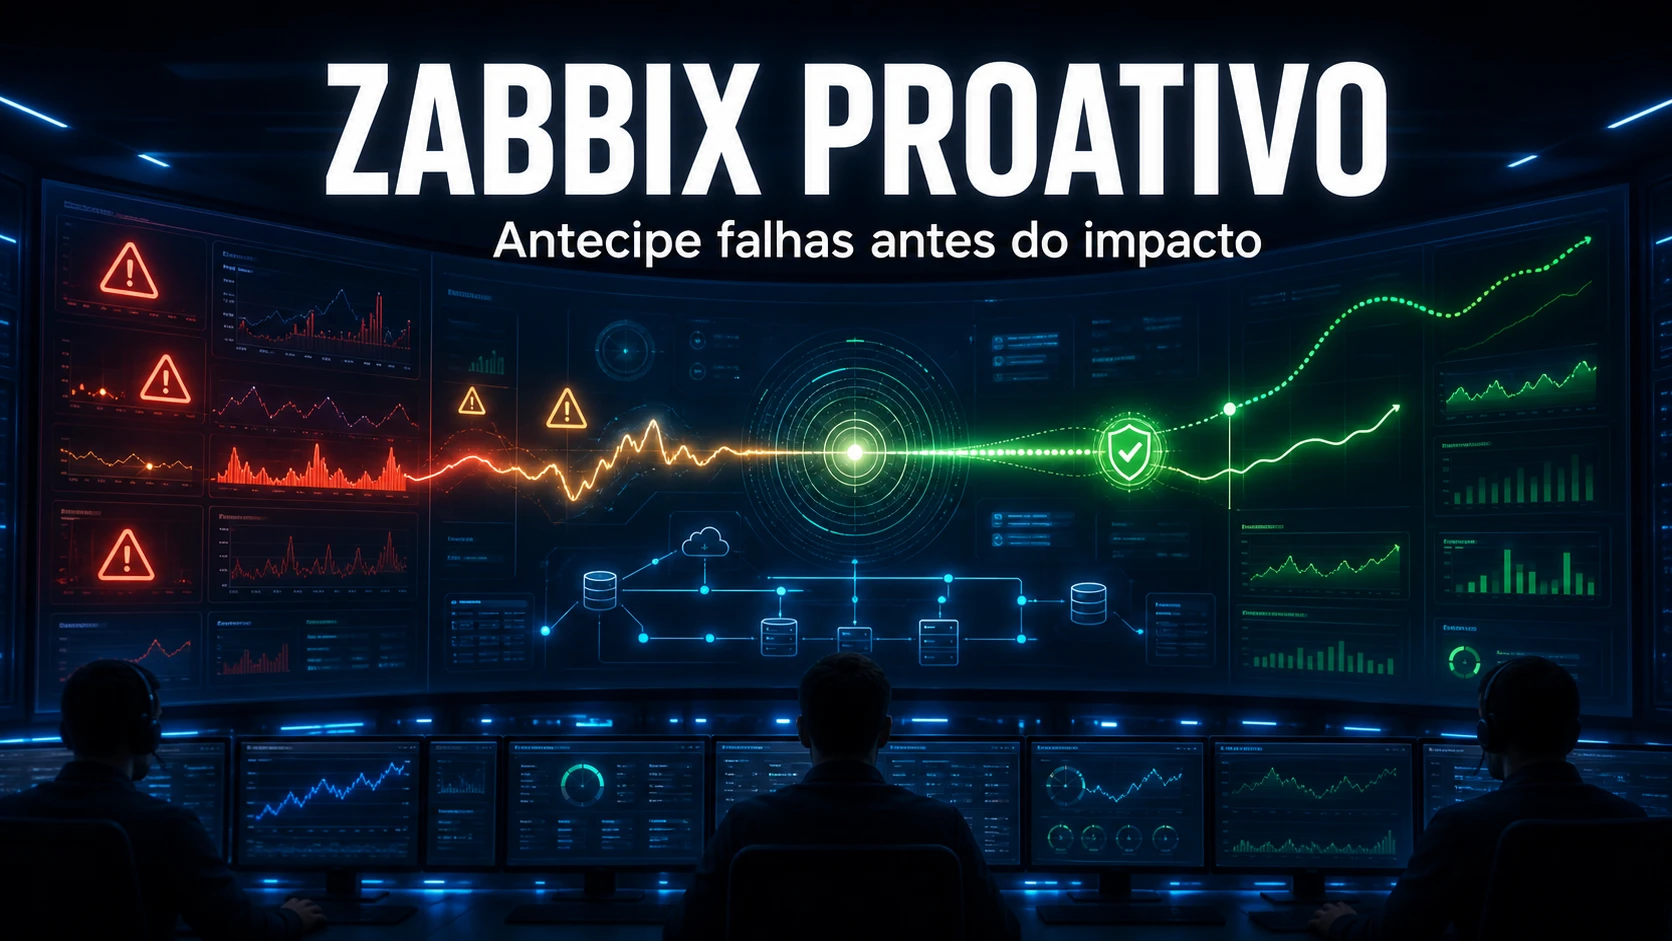
Zabbix becomes proactive monitoring when the alert stops being an email nobody reads and becomes a GLPI ticket with an owner, a priority and context. At NexTool, Zabbix does not run in isolation: it sits next to the GLPI we already maintain for the client, and every meaningful trigger is born wired to a response flow. This post shows how we deploy and maintain that pair - from the architecture to the real trigger and the integration with the NexTool Automations module.
Architecture: Zabbix beside GLPI, not competing with it
The classic mistake is to treat Zabbix and GLPI as separate worlds: Zabbix screams, someone notices, and opens the ticket by hand. That adds minutes (or hours) between detection and action, and it depends on a human watching the dashboard. In our deployment, Zabbix Server runs in a container next to the client's stack, with Zabbix Agent 2 on the monitored hosts. The integration point is Zabbix's webhook media type, which fires a POST to the stateless endpoint of the NexTool Automations module - and it is Automations that creates the GLPI ticket, with per-flow HMAC SHA-256 authentication.
This separation of roles matters: Zabbix decides what is a signal worth acting on (the trigger); Automations decides how that becomes work in the service desk (category, entity, urgency, technician). Changing one without touching the other becomes trivial.
Triggers that matter: time window and recovery, not an isolated spike
In our maintenance work, the number one reason "everyone mutes Zabbix" is flapping: a 2-second CPU spike raises and clears the alert dozens of times per hour. The defense is twofold - evaluate over a time window and use a separate recovery expression (hysteresis), so the problem only closes when it has truly stabilized. A trigger for a filling disk, written to predict the failure before it happens, looks like this:
# Trigger: root filesystem will fill up within the next 24h (prediction, not reaction)
# name: "Disk {HOST.NAME}: predicted saturation of / within 24h"
timeleft(/Linux by Zabbix agent/vfs.fs.size[/,pfree],1h,0)<24h
  and
last(/Linux by Zabbix agent/vfs.fs.size[/,pused])>80

# Trigger with hysteresis (recovery different from problem) to avoid CPU flapping
# Problem  expression:
avg(/Linux by Zabbix agent/system.cpu.util,5m)>90
# Recovery expression (only clears when it really drops):
avg(/Linux by Zabbix agent/system.cpu.util,5m)<70
The timeleft() function is the heart of "proactive": from the trend, it projects how long is left before the disk fills up - and alerts while there is still time to act, not when the service is already down. The common mistake here is using last() on a 95% usage value and calling it proactive; it is not, it is reactive with a looser threshold.
Templates and macros: consistency across hosts
We standardize servers, network and applications through a linked template, with thresholds exposed as macros ({$CPU.UTIL.CRIT}, {$VFS.FS.PUSED.MAX.CRIT}). This way a host that legitimately lives with high usage (a database, for example) receives a macro override on the host itself, without duplicating the trigger or breaking the pattern of the other 200 hosts. This speeds up onboarding of new hosts and prevents the silent drift that corrupts any mature monitoring setup.
GLPI integration: the webhook that becomes a ticket
The Zabbix webhook media type is a JavaScript script that builds the payload and does the POST. What we send to Automations carries enough for the ticket to be born with context - severity, host, item, value and the {EVENT.ID}, which we use as an idempotency key so we do not open two tickets for the same event:
// Zabbix media type (webhook) -> NexTool Automations -> GLPI
var req = new HttpRequest();
req.addHeader('Content-Type: application/json');
req.addHeader('X-Signature: ' + hmacSha256(params.payload, params.secret));

var payload = JSON.stringify({
  event_id:   '{EVENT.ID}',        // idempotency key
  severity:   '{EVENT.SEVERITY}',  // mapped to GLPI urgency
  host:       '{HOST.NAME}',
  trigger:    '{TRIGGER.NAME}',
  value:      '{ITEM.VALUE}',
  status:     '{EVENT.VALUE}'      // 1=problem, 0=recovered
});

var resp = req.post('https://glpi.client.com/automations/hook/zabbix', payload);
return JSON.stringify({ tags: [{ tag: '__glpi_ticket', value: resp }] });
On the GLPI side, the Automations flow maps the Zabbix severity to the ticket urgency, picks the right category and entity, and assigns it to the responsible technical group. When the event recovers (status: 0), the same flow can add a "resolved automatically" follow-up or close the ticket - closing the loop detection -> action -> resolution without manual intervention.
Reactive vs proactive, in practice
| Dimension | Reactive monitoring | Proactive monitoring |
|---|---|---|
| Trigger | Service already down (last() = 0) | Trend predicts the failure (timeleft(), forecast()) |
| Window | Instant value, isolated spike | Average/trend over a window (5m, 1h) |
| False positives | High (flapping) | Low (hysteresis/recovery) |
| Result in GLPI | Ticket opened late, without context | Ticket with owner, urgency and event value |
| Effect on the team | Alert fatigue, dashboard ignored | Few alerts, all actionable |
Common mistakes we fix in maintenance
- No recovery expression: problem and recovery use the same condition, the alert blinks. Always define hysteresis on volatile metrics (CPU, latency).
- Severity without mapping: everything arrives in GLPI as "medium". Map
Disaster/Highto high urgency and keepInformationon the dashboard only, without creating a ticket. - No idempotency: webhook retries create duplicate tickets. Using
{EVENT.ID}as the key solves it. - Alerting without an owner: a trigger that does not point to a group/technician is noise. Every actionable alert needs an assignment route in the Automations flow.
If you already have GLPI and want Zabbix to stop producing ignored emails and start producing tickets with an owner and context, this deployment and maintenance work is what NexTool delivers - from the template to the integration flow. Talk to us about support and maintenance for your GLPI + monitoring environment.
Reviewed by the NexTool Solutions team.